

Data Analysis, Machine Learning & Visual Reports
DataForest is an AI data analysis desktop app for individuals and small teams. Work from your own questions to process data, run machine learning, build visualizations and create reports, turning scattered data into results you can understand, review and use.
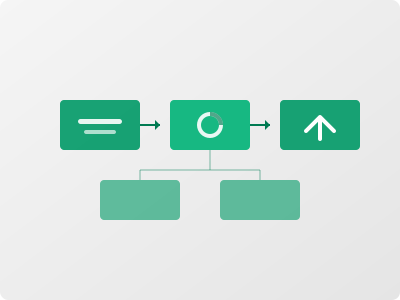
AI data analysis
Prepare your data
DataForest handles common formats including Excel, CSV, JSON and Parquet. Start by organizing fields, checking missing values, summarizing statistics or comparing trends.
Run an analysis
Yes. Run classification, clustering and time-series forecasting with built-in data tools such as pandas, NumPy and scikit-learn. Choose methods that fit your question and data, and review model performance, errors and limits. Predictions are uncertain; model output is not a guarantee of future events.
Review the evidence
DataForest emphasizes reviewable analysis. AI creates a plan for each task, documents evidence for questions and insights, and makes output files, code and content available for inspection. This helps you check conclusions and spot AI hallucinations.
Create charts and reports
Yes. Visualize your results and create PPT, Word, PDF and Excel deliverables for coursework, research, content creation or team discussions. Before sharing, check that chart definitions, sources and report conclusions agree.
Who it is for
- Students: surveys and coursework
- Teachers and researchers: teaching and experimental data
- Cross-border ecommerce: sales, costs and operations
- Startup teams: research and decision support
- Creators and YouTubers: content performance and audience feedback
- Individual investors: historical market and public financial data
Start with a specific data question
Analyze data in multiple formats. Use AI, machine learning, charts and reports with DataForest, for individuals and small teams.
Download software